Configuring the Timeline tool
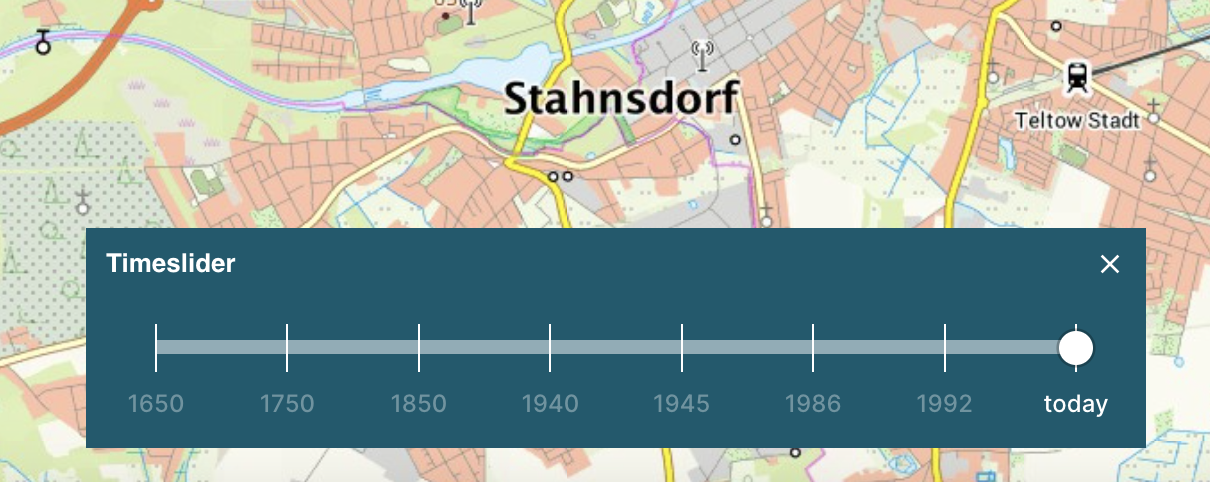
With the timeline tool, you can elegantly prepare historical data for users. Of course, it is also possible to simply make historical data available as layers via the layer tree. However, the timeline offers the option to quickly "slide" through the available years. It is also possible to load multiple layers per year simultaneously. For example, clicking on an example date "2022" can load the corresponding true orthophoto, the 3D mesh, and the oblique aerial photographs simultaneously. Individual descriptions can also be stored for each time period (see figure).
This tutorial explains how to create a timeline for your view. To use the tool, you need access to the PlexMap backend and at least one of the apps PlexMap 3D, PlexMap 2D, PlexMap Points, PlexMap Street360°, and PlexMap Oblique.
Demo: This link provides a demo of the timeline tool using the example of historical Berlin.

Necessary settings under View Settings: Layer Anchor
To set up a timeline, you need to make settings in your view's settings, both in the "Layer" and "Tools" tabs.
In your view's settings, first navigate to the "Tools" tab. The quickest way to find the timeline tool is to enter "Timeline" in the search bar at the top under Tools. Once there, activate the timeline using the corresponding checkbox to the right of "Timeline." Use "Tool Name" to specify the tool's title (here: Time Slider). This means you can also use the tool to prepare planning variants, for example, and not just historical data. In the following settings, you can specify whether the timeline should initially be active when the view loads and whether you want a consistent spacing between the time steps. If the spacing is not set consistently, the spacing between the time periods "1960" and "1990" will be greater than the spacing between "1998" and "1999."
Under "Default Date," you specify the initial date when you start the tool. Under "Time Steps," you then specify the desired time points for your timeline. Each time point has at least one date and a name (here, for example, "1650"). Optionally, you can add a description. This can be accessed later in the tool via a separate button. There is no limit to the number of saved time points. However, at least two time points must be saved for the tool to function.
This completes all settings under "Tools." Now go to the next chapter and specify the settings in the "Layers" tab.

Necessary settings under Viewsettings: Tools Anchor
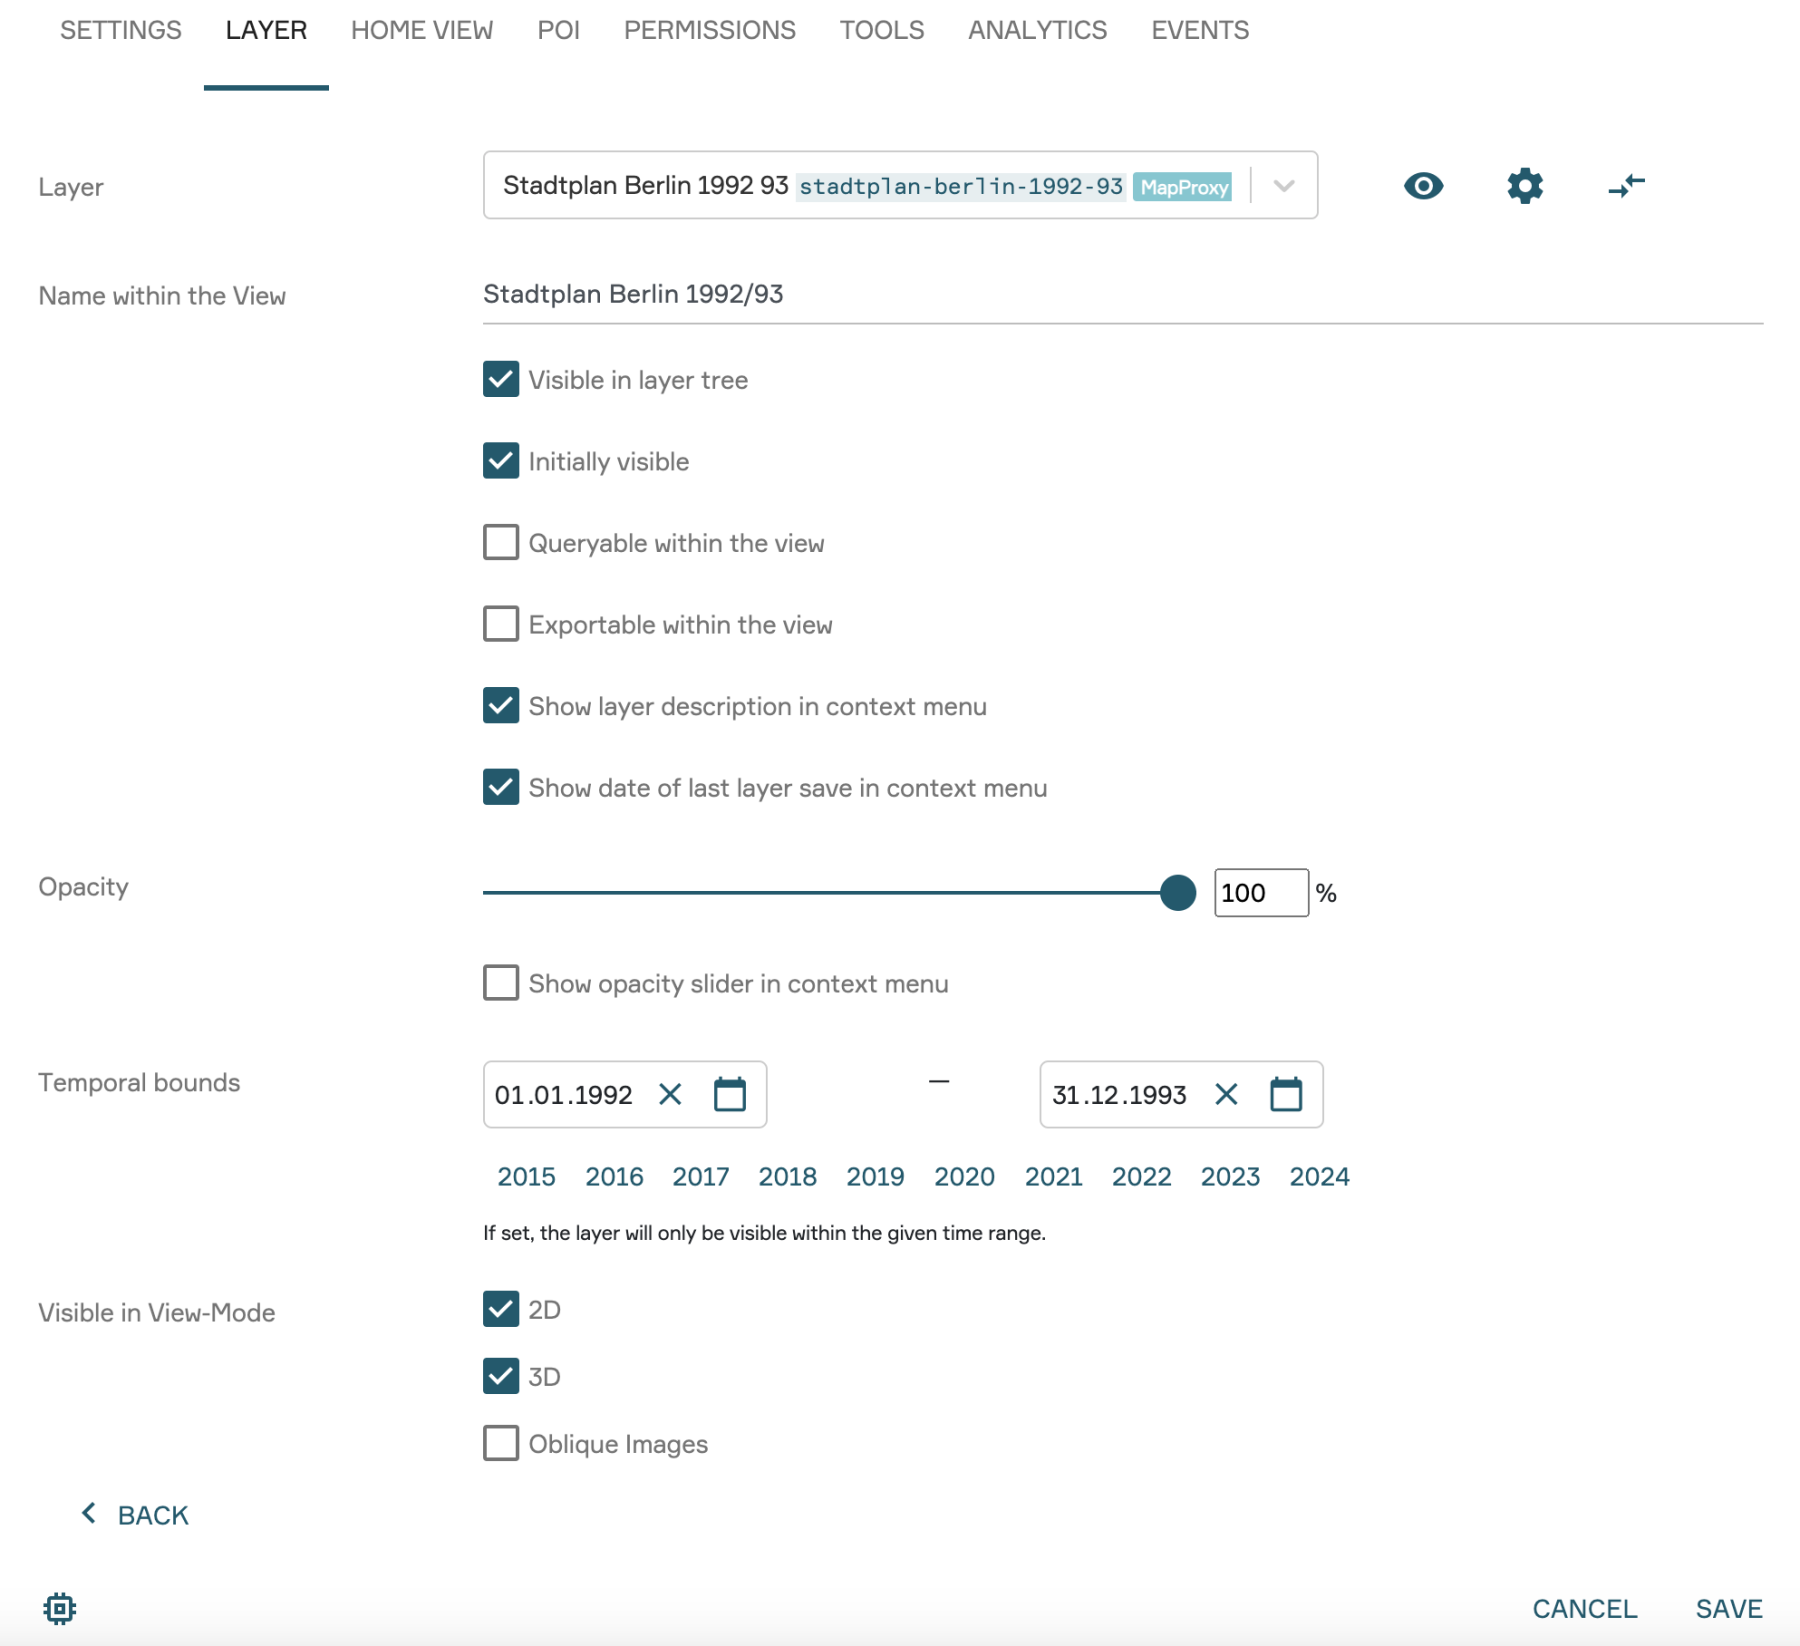
Now navigate to the "Layer" tab in your view's settings. Find a layer you want to include in the timeline tool. In our example, this is "Berlin Building Age 1992_1993." Click the small arrow on the far right of the row for the desired layer. You are now in the settings for this layer (see figure). Various settings can be made here. However, only the "Time Limit" section is relevant for the timeline tool. This is where you define the layer's scope. For example, if you previously created the time 1992 in the view settings under Tools and want to assign the selected layer to this time, specify "01/01/1992 to 12/31/1992" under "Time Limit."
Now click "Save." This completes the settings for the selected layer. Repeat this process for all layers you want to appear in the timeline tool to complete the setup of the timeline tool for your view.
Interesting facts Anchor
Das fertig eingerichtete Tool kennt den räumlichen Geltungsbereich Ihres Layers. Navigieren Nutzende in der Karte aus diesem Bereich heraus, werden die dort nicht verfügbaren Zeitstände ausgegraut und sind somit nicht auswählbar, bis die aktuelle Kartenansicht wieder auf den räumlichen Geltungsbereich des Layers eingestellt wurde. Tipp: Im Layerkontextmenü können Sie über die Funktion "Auf Ebenenausdehnung zoomen" schnell wieder in den räumlichen Geltungsbereich des Layers springen.